Capital Wealth Model Portfolios
The House View · One Theme— days to November 3, 2026

The play to 2027.

AI is the new inflation. Washington keeps spending into a strong economy while the AI build-out soaks up chips, power and capital — so prices stay hot and the Fed stays boxed in. We own what benefits — energy, gold, defense, the AI supply chain — and we keep a standing hedge for the year growth stalls. One theme; every book on this page is an expression of it.

Now → OctDe-risk into the chop. Midterm years carry the deepest average intra-year drawdown of the four-year cycle. Nov 3Defend the vote. November has five roads; this calendar is Road 1, the base path — and the books cover the other four by construction: early relief (R2) stays invested, our theme running hotter (R3) is the hard-asset books, the growth scare (R4) is the standing hedge, and the T-bill + gold reserve is sized for the contested count (R5). No road changes the theme — only the calendar. Nov → 2027Re-risk the rally. The S&P 500 has been higher twelve months after every midterm election since 1946.

How the shelf fits the theme — Midterm Dividend books: the calendar expression · AI, hard-asset & theme books: the growth expression · Theme 4 Stagflation Defense: the standing hedge, always on · Core books ($50K–$500K): the whole theme at your account size.

Find Your Book · Ten Seconds

Three questions, one book.

Seated the way a quant desk does it — risk capacity (your size), risk aversion (your style), view alignment (run our theme, or just own the market) — then matched against each book’s realized volatility, Sharpe ratio and max drawdown. The financial-engineering math, in plain English.

1 · Account size
2 · Style
3 · The view

Not sure on style? The two-minute risk quiz answers question 2 for you. The match is a starting point, not advice — the fit conversation is fifteen minutes. Methodology: how we build →

Your match
Loading…
Loading portfolio data…

A mountain range rising above a sea of clouds at sunriseCapital Wealth · The Books
Four Views Of The Market

Pick the market you believe in.

Four ways the next twelve months could go — inflation stays hot, the AI build-out keeps accelerating, rates come down gently, or growth stalls while prices don't. Each view has a portfolio built for it. Our money is on the first two — they're the same trade: the build-out is what's keeping prices hot (Theme 5, "AI is the new inflation").
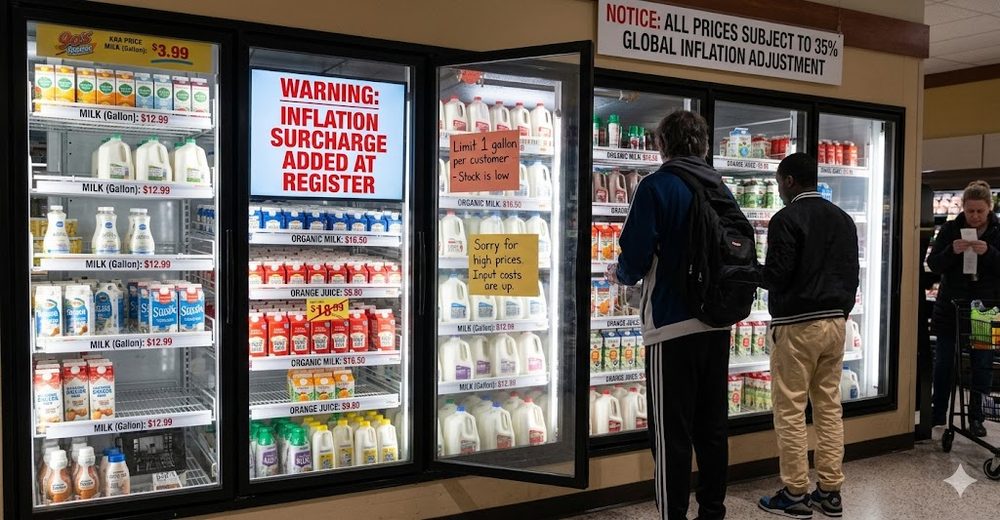
Grocery prices — inflation
View 01

Inflation Stays HotOur view

Washington keeps spending into a strong economy, so prices keep climbing. Own energy, gold, defense and companies that can raise prices — not long-term bonds.

Read the full case →

AI data center
View 02

The AI Build-Out AcceleratesOur view · same trade

Hundreds of billions in data-center spending each year. Own the whole supply chain — chips, memory, power, networking — not just one stock.

Read the full case →

Housing gets its turn as rates ease
View 03

Rates Come Down Gently

Inflation cools, the Fed cuts, and everything that's been left behind — small caps, housing, real estate — finally gets its turn.

Read the full case →
Prices staying high
View 04

Growth Stalls, Prices Don't

The hardest market — a slowing economy with sticky inflation. The defensive book: staples, healthcare, gold and T-bills. This is the insurance policy.

Read the full case →
Election Watch
— days to November 3, 2026

Five roads to the midterms — and the book for each

One thing these five are not: five themes. The theme above decides what we own; the roads only decide how November plays out around it — five branches off one calendar, each pre-assigned a book. Three of them are just the theme at different temperatures.

S1
The Textbook MidtermRoad 1 · base path — the house calendar

Chop into October, relief after the vote. Defensive payers carry you in; the discretionary sleeve catches the turn.

S2
Gridlock Gets Priced Early

Divided government firms up early and the relief rally starts ahead of schedule. Broad quality re-rates; stay invested.

S3
Fiscal Heat Into The Vote

Campaign promises land on a hot economy — our standing theme runs hotter into the vote. Not a new view: the same trade, more of it — energy, gold, pricing power (Theme 1).

S4
The Growth Scare

The data cracks before the country votes. Staples, healthcare and T-bills do the work (Theme 4 is the standing hedge).

S5
The Contested Count

Recounts and litigation — a sharp volatility spike with a short historical half-life. The T-bill + gold reserve is sized for exactly this week.

Deep-dive briefs for each scenario — market path, what leads, what to watch — live on the Themes page →

Everything Else

Tools, reports & the protected-growth side

The reference material that used to live scattered down this page — one line each.

The Risk AtlasThe eight things that can actually go wrong — market, rate, inflation, geopolitical, credit, concentration, event, behavioral.Open → Which Sleeve Covers WhatThe eight Atlas risks against the books — which sleeve is carrying which risk, and the three squares we'd rather you hear from us.Open → The LettersOur daily read of the Journal — every edition and specialty deep-dive, searchable in the archive.Open → Portfolios by DecadeIn your 30s, 40s, 50s or 60s — how the aggressive-to-dividend mix moves, with the evidence.Open → Combination PortfoliosManaged market core + annuity-protected floor + income — every dollar gets one job.Open → Reading the NumbersSharpe, beta, drawdown, yield — every metric on these pages in plain English, with live examples.Open → Marked to Market — The Track RecordEvery call we publish, graded against the market — rights, wrongs, and open positions. Wrong rows never leave the page.Open → Investment Commentary №2 — The Report CardA decade of LPL outlooks graded against the market, their midyear vs. the July 29 close, and what the books did.Open → Investment Commentary №1Where is the market headed? Prediction-market odds, the theme tracker, and what the books did.Open → Sequence of ReturnsThe evidence note behind the 50s de-risking step — same average return, opposite outcomes.Open → How Many Stocks?The diversification evidence (Statman, Bessembinder) behind the income books' 25–80 names.Open → Watchlist & Recent ChangesWhat we're watching and the latest adds, trims and exits across the books.Open → Reports & Fact SheetsPrintable one-pagers per model — performance, risk stats and holdings.Open → 403(b) Vanguard FundsThe school-plan menus: five Vanguard passive mixes plus the CWLG custom tiers.Open → Full Data TablesThe complete table view — every model, every holding, every weight (client passcode).Open → MethodologyHow we build: the CFP-grounded construction standards behind every book.Open → Risk QuizTwo minutes to find which tier fits — conservative to aggressive.Open → Protected GrowthThe annuity side: floors and guarantees for the money that can't ride out a drawdown.Open → Retirement CalculatorProject savings, income and the gap — with and without the guardrails.Open →
The Literature

The papers behind the construction

The seating engine, the stat strip, and the book construction aren’t house inventions — they’re the financial-engineering canon (the same papers an MFE curriculum runs on), applied and cited. What each one grounds here:

Markowitz (1952)“Portfolio Selection,” Journal of FinanceWhy the books are sleeves, not stock lists. Risk lives at the portfolio level — mean-variance construction is why every book is built as weighted sleeves with a job each.
Sharpe (1964; 1994)CAPM, Journal of Finance · “The Sharpe Ratio,” JPMThe stat strip. The beta and Sharpe printed on every model page are these two papers, computed on our daily NAVs.
Black & Litterman (1992)“Global Portfolio Optimization,” Financial Analysts JournalQuestion 3 of the seating engine. Start from market equilibrium; tilt only where you hold a view, sized to conviction. Core books = the equilibrium; tactical and theme books = the view. That’s the whole house architecture in one paper.
Merton (1969) · Samuelson (1969)Review of Economics and StatisticsQuestion 2. Lifetime portfolio choice — risk aversion and horizon drive the allocation, which is why style is asked before any ticker appears, and why the Decades page exists.
Brinson, Hood & Beebower (1986)“Determinants of Portfolio Performance,” FAJAllocation first. The order of operations — sleeve weights before stock picks — because allocation explains most of the variance of returns.
Grossman & Zhou (1993)“Optimal Investment Strategies for Controlling Drawdowns,” Mathematical FinanceWhy Max DD is a first-class stat. Drawdown control as a formal constraint — the reason the cash reserve exists and the reason we print maximum drawdown next to return on every book.
Statman (1987) · Bessembinder (2018)JFQA · Journal of Financial EconomicsThe 25–80 names per book. Diversification’s marginal benefit and the skewness of single-stock returns — our evidence note walks both.
Santa-Clara & Valkanov (2003)“The Presidential Puzzle,” Journal of FinanceThe calendar books. Political cycles show up in return data — the academic backbone under the midterm series and the five roads.

Citations ground methodology, not predictions — none of these authors endorse these books, and the market grades us either way (Marked to Market).