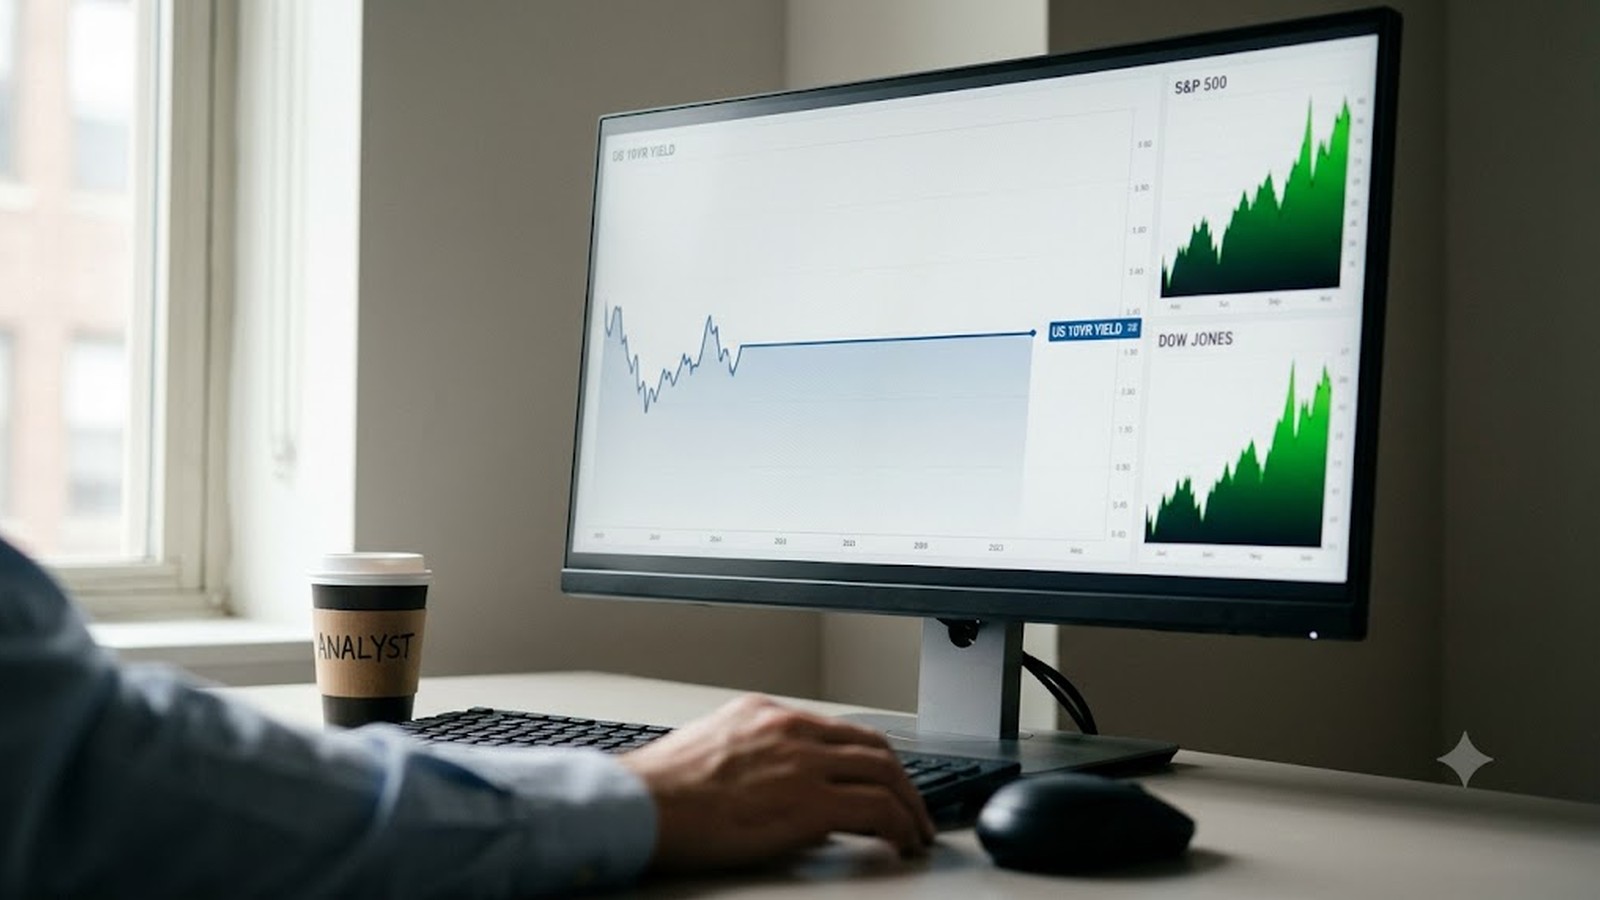
Here is a statistic worth keeping. The 10-year Treasury yield settled above 5% on Wednesday for the first time since July 2007. The last eight times it closed above that line, it was back underneath within two months — and the average stay, per Dow Jones Market Data, was twelve trading days.
Twelve days. That is the kind of number that makes a person feel clever about waiting it out.
The part the average leaves out
All eight of those short visits happened in 2006 and 2007. Widen the lens and the picture changes. The 10-year stayed above 5% for 69 straight trading days from March 2002, and there were longer stretches in 2001 and in 1999–2000.
Go back a little further and the whole frame inverts. Before September 1998, the Journal notes, the 10-year yield was above 5% for more than two decades. A 5% benchmark wasn’t an event. It was the weather.
So the base rate depends entirely on which era you think we are in — and that is not a question anyone gets to answer in advance. Which is the actual lesson, and it is a planning lesson rather than a trading one.
Why the line matters at all
Because the 10-year is the reference rate for the borrowing that shapes a household. Mortgages track it. Corporate bonds track it. The discount rate that decides what a dollar of future earnings is worth today tracks it. When the benchmark moves, the price of nearly everything quietly re-sorts.
The Journal attributes the climb to a mix: higher expected growth from the AI build-out, competition for capital from data-center borrowing, and open questions about how high the Fed has to go. Notably, long rates barely moved on Wednesday’s decision itself — the 30-year finished roughly flat. The market had already done the arithmetic.
What to do with a number you can’t predict
Build a bond position you would be content to hold under either history. In practice that means knowing your duration — how far a bond’s price moves when rates change — and matching it to when you actually need the money, rather than to a view about 2027.
Money needed within a few years generally sits better short, where a rate increase raises the income instead of marking down the price. Money that isn’t needed for a decade can afford to care about the yield it locks in today, which is the best it has been since before the financial crisis. Both of those statements can be true at once, and for most households they are.
You don’t need to guess whether this is a twelve-day visit or a twenty-year address. You need to know which of your dollars would mind.