
Stocks had their worst day of the year on Thursday and their best day since April on Monday. The year is still up about 10%, and here is what the record since 1950 says about the seven weeks left.
What to Expect From Here
Hi there. Last week scared a lot of people. So this letter answers the questions we keep hearing, one at a time, in plain words.
Update, Tuesday morning, Nov. 10: the inflation report came in hot.
This letter was written Monday night. Tuesday morning brought the October inflation report. Prices rose 0.4% for the month, news reports said. Economists expected 0.3%. Core prices, without food and energy, rose 0.3% against 0.2% expected.
That is one of the things we list below that could raise the odds of another drop. By our own pull at 8:56 a.m. PT, the S&P 500 was down 0.91% at 7,481.56. The 10-year Treasury yield was back at 5.01%. Nvidia was down about 6.6%. The crowd now puts a December rate hike at 84.5%, and a half-point hike at about 11%. Crowd prices, not forecasts.
Nothing in the plan below changes because of one report. The rest of the letter is as we wrote it Monday night.
Last week was rough. On Thursday, Nov. 5, the S&P 500 fell 4.36% to 7,353.73. The Journal called it the biggest one-day drop since April 2025. That left the index about 6% under its Oct. 6 record of 7,818.93.

Friday it rose a little, to 7,376.86. Then came Monday. By our own pull, the S&P 500 rose 2.35% to 7,549.94. News reports called it the best day since April.
Why the bounce? Oil fell on hopes for a peace deal between the U.S. and Iran. The VIX, Wall Street’s fear gauge, dropped to 19.92. It was 28.18 on Thursday.
Not everything rose. Nvidia fell about 4% on its own news. And the index is still 3.44% under its record.
One more fact matters. Friday’s jobs report was strong. Employers added 165,000 jobs in October. Economists expected 59,000. Unemployment was 4.1%.
A bad Thursday and a great Monday. The year is still up about 10%.
It already is. Through Monday the S&P 500 is up 10.29% for 2026, by our own pull. It ended 2025 at 6,845.50.

To finish the year down, the index would have to fall about 9.3% in seven weeks.
How often has that happened? Once since 1950, price only, by our own count. In 2018 the index fell 9.9% from Nov. 9 to Dec. 31.
Here is another way to see it. Since 1950, 39 years were up 8% or more on Nov. 9. All 39 finished the year up.
Four of them did end below their Nov. 9 level. Those were 1964, 1982, 1986 and 2024. So a late slip is normal. Losing the whole year’s gain is rare.
The crowd leans the same way. On Polymarket, traders put roughly 70% on a year-end close above 7,000. That market is thin. These are crowd prices, not forecasts. Our own rough arithmetic from the VIX says about 1 in 10 for a finish below 6,845.50.
Do we still expect a negative year? No. The record and the math both lean the other way. A positive year is the likely case. It is not a promise.
There are two different stats here. People mix them up.
The first one says every midterm year since 1950 had a decline before the vote. This year had one too. From Jan. 27 to Mar. 30 the S&P 500 fell 9.1%, from 6,978.60 to 6,343.72. So that stat held. It is now 20 for 20.

The second stat is the hopeful one. In the 12 months after every midterm vote since 1950, the S&P 500 went up. By our own count, price only, that is 19 of 19. The average gain was 15.1%. The middle one was 14.5%. The weakest was 1.1%, after the 1986 vote.
Our September letter quoted First Trust’s average of about 18.8%. They count it a different way. We use our own count here.
Show as a table
| 1954 | +33.2% |
| 1994 | +27.1% |
| 1990 | +25.1% |
| 1962 | +24.8% |
| 1998 | +22.0% |
| 1982 | +19.9% |
| 1974 | +18.7% (fell 13.4% first) |
| 1950 | +16.2% |
| Average | +15.1% |
| 2002 | +14.9% (fell 12.5% first) |
| 2022 | +14.5% |
| 1966 | +12.9% |
| 1970 | +12.7% |
| 2018 | +11.7% (fell 14.7% first) |
| 1958 | +11.1% |
| 2006 | +6.7% |
| 1978 | +6.4% |
| 2014 | +4.5% |
| 2010 | +3.7% |
| 1986 | +1.1% |
This year’s clock started at the Nov. 3 close of 7,568.92. Monday’s close is 0.25% under it.
Can the stat be wrong this time? Yes. Nineteen is a small number. A pattern is not a law.
And the ride was not always smooth. In 3 of the 19, the market first fell 10% or more from its election-day close. That was 13.4% after 1974, 12.5% after 2002 and 14.7% after 2018. Each still ended the 12 months up.
What could make 2026 the exception? We see five things.
The Fed. It raised rates in September. Traders now put a December hike near 80%. Raising rates into slower hiring has hurt stocks before.
Paychecks. Pay rose 3.1% over the past year. Prices rose about 3.7%. The Journal says this is likely the seventh straight month that pay trailed prices.
AI costs. The Journal reports that shortages of chips and power are pushing costs up. Companies can’t pass all of it on.
Price. The S&P 500 trades at 22.37 times the past year’s profits, the paper’s table shows. A year ago it was 25.75. That is cheaper than it was. It is still not cheap.
Oil. Peace talks could fail. The Journal reports that some U.S. officials want to resume strikes on Iran later this month.
Nineteen for nineteen is a good record. It is not a law.
It is possible. It is not what the record points to before the year ends.
Start with history, since 1950, price only, by our own count. A drop of 10% or more at some point between Nov. 9 and Dec. 31 happened in 4 of 76 years. Those were 1973, 1974, 2008 and 2018.
Over a whole year, a 10% drop is ordinary. It happened in 41 of 76 years. So expect one again someday. Just don’t expect to know the month.
Thursday’s drop has a short history of its own. We found five earlier times the index fell 4% or more in a day while still within 10% of its high. All five times it was higher three months later and six months later. None fell another 10% within three months. Five is a tiny sample, so read it as a comfort, not a rule.
Now the rough odds to Dec. 31, from the VIX. About 1 in 3 for touching 7,037, which is 10% under the record. About 1 in 6 for touching 6,795, which is 10% under Monday. About 1 in 30 for 6,417, which is 15% under Monday. The VIX usually runs higher than what follows, so treat these as the high end.
Show as a table
| 7,271.60 (7% under the record) | about 62% |
| 7,200 | about 53% |
| 7,037 (10% under the record) | about 35% |
| 6,795 (10% under Monday) | about 16% |
| 6,417 (15% under Monday) | about 3% |
What would raise the odds? A hot inflation report, like the one that came Tuesday morning. A rate hike on Dec. 9 with a tough message. A new crack in AI spending. Or oil spiking again.
The Santa Claus rally is a small window. It covers the last five trading days of December and the first two of January.
Since 1950 it was up in 58 of 76 years, by our own count. That is 76%. The average gain was 1.25%.
But the last three were small losses. Those were 2023, 2024 and 2025.
December as a whole was up in 55 of 76 years, with an average gain of 1.41%. In midterm years it was weaker. It was up in 12 of 19, and the average gain was 0.82%.
Show as a table
| Santa Claus window | 58 of 76 years |
| Nov. 9 to Dec. 31 | 58 of 76 years |
| December | 55 of 76 years |
| December, midterm years | 12 of 19 years |
The December to remember is 2018. It was the worst December since 1950. The index fell 9.2%. That was the month the Fed raised rates on Dec. 19 into a falling market.
This year the Fed meets Dec. 8 and 9. A hike is priced near 80%. So we would not count on Santa. We would be glad to see him.
The National Retail Federation expects a record. Its Oct. 15 forecast, by news reports, has November and December sales up 4.2% to $1.013 trillion. That would be the first season over $1 trillion.

But look closer. Prices are up about 3.7%. So much of that gain is higher prices, not more stuff in the cart.
Families are stretched. Pay is up 3.1% and has trailed prices for about seven months. Workers’ share of what businesses produce fell to 53%. The paper says that is the lowest in 80 years of data.
There is some help. Heating oil futures are down about 12% since Oct. 30, by our own pull. Oil itself fell more than 4% on Monday, to $86.85 a barrel. Cheaper fuel leaves more money for gifts.
Stocks tell the same split story. A fund of retail stocks rose 3.66% on Monday. But the fund of “wants,” consumer discretionary, is up only about 1.3% this year. The fund of “needs,” consumer staples, is up about 17%.
Here are the facts, as reported. We take no side on the policy.
On Tuesday, Nov. 3, President Trump said U.S. military aid to Israel would be cut off by the end of the year. The aid is $3.8 billion a year. The Journal says that is about 0.5% of Israel’s economy.

Much is still unclear. The White House has not said which funding it means. The aid runs under a 10-year agreement that can’t simply stop overnight. One Israeli paper reported a different plan, to halve the aid and phase it out over five years. That report is not confirmed. In Israel, the president gave Gadi Eisenkot the first try at forming a government.
Most of the money is spent on American-made weapons. So does it hurt U.S. defense companies? Not by much, on the numbers. The Journal reports a proposed U.S. defense budget of $1.5 trillion. Next to that, $3.8 billion is small.
Defense stocks rose with the market on Monday. Lockheed Martin gained 3.72%, by our own pull. It had lost 7% the day after the vote, the Journal notes.
For your money, the bigger question in the region is oil. If the Iran war winds down, oil can keep falling. If the talks fail, it can jump again.
First, the honest answer. We bought no new sector this week. This letter does not tell anyone to buy one. Here is what the year shows, by our own pull, price only.
The average stock beat the index. The plain S&P 500 fund is up 10.38%. The equal-weight fund, where every company gets the same share, is up 15.34%. Small companies are up 14.77%.
The steady corners led. Health care is up 21.66%. Consumer staples are up 17.01%.
The loud corners swung. A chip-stock fund is up 46.20% this year, with the wildest ride. Energy is up 38.54% for the year. But it has lost 11.54% since Oct. 30 as oil fell.
Some corners went nowhere. Consumer discretionary is up 1.34%. Utilities are up 2.58%. Aerospace and defense is up 0.15%.
Show as a table
| Chips (SOXX) | +46.20% |
| Energy (XLE) | +38.54% |
| Health care (XLV) | +21.66% |
| Staples (XLP) | +17.01% |
| Equal-weight S&P 500 (RSP) | +15.34% |
| Small companies (IWM) | +14.77% |
| S&P 500 (SPY) | +10.38% |
| Utilities (XLU) | +2.58% |
| Consumer discretionary (XLY) | +1.34% |
| Aerospace and defense (ITA) | +0.15% |
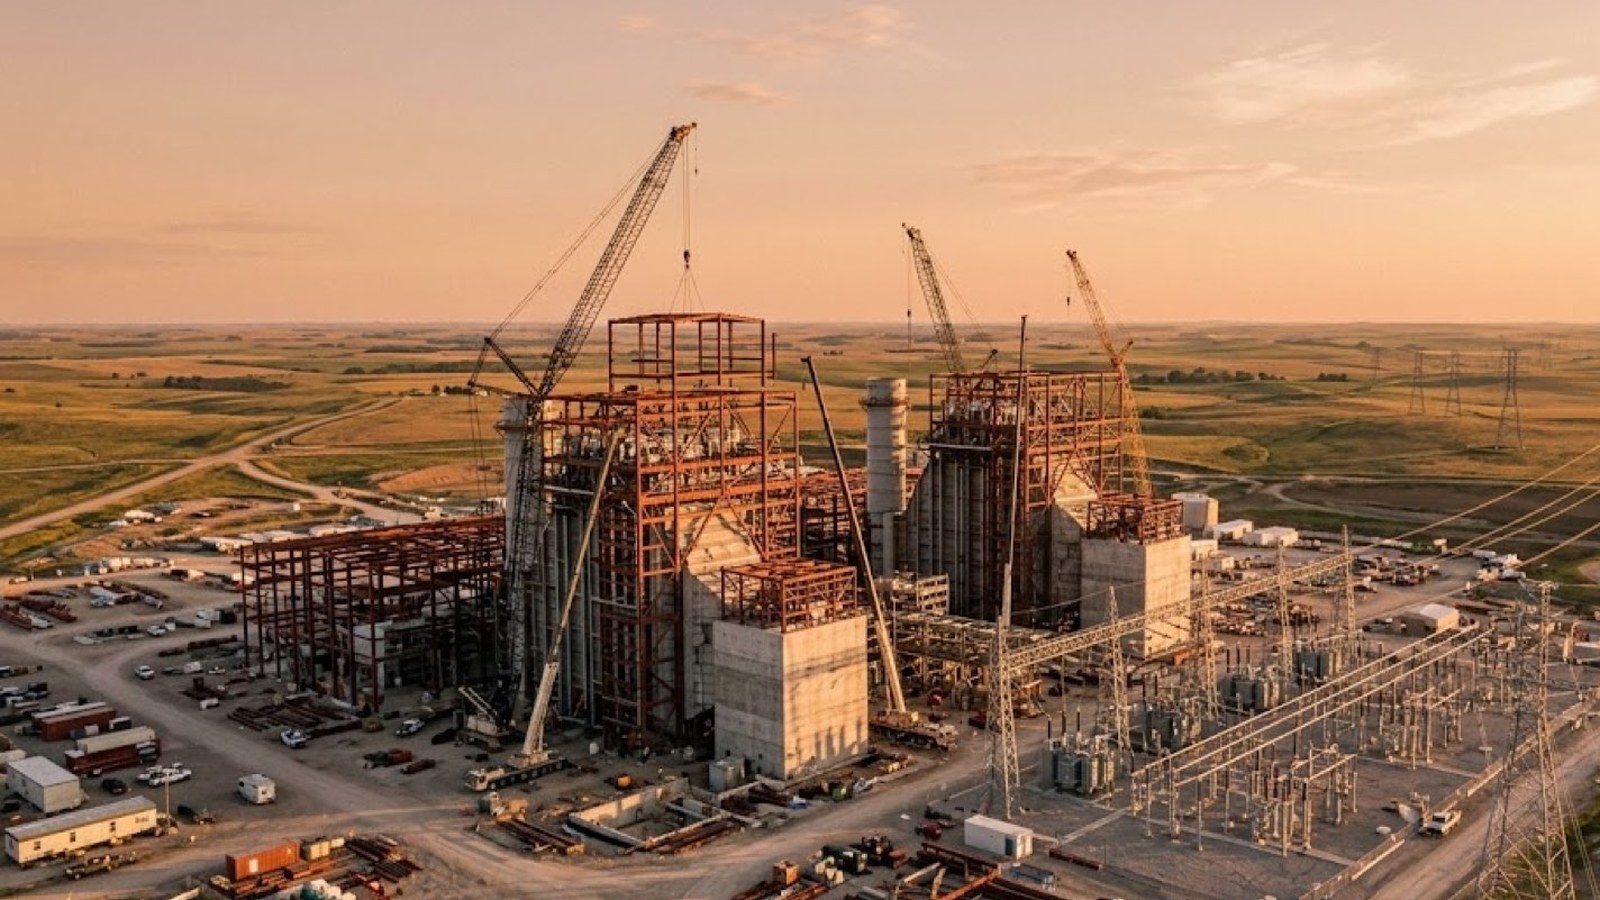
Now, how our model portfolios are built. They lean on broad, equal-weight ownership. They hold the companies building out the power grid: GE Vernova in 30 books, NextEra in 21 and Vistra in 17.
They hold health care and staples. They hold energy as a hedge. That hedge has less work to do if peace holds. Our written rule for trimming Valero is unchanged.
They hold gold as insurance, in 46 books. And they hold Treasury bills for money that is needed soon.
What are we watching, not buying? Two things. One is what Tuesday’s hot inflation report and the Dec. 9 Fed decision do to the AI and chip stocks. The other is whether cheaper oil turns into real help for shoppers.
On Friday, Nov. 6, after the open, the second third of our North Star reserve went to work. We reported that in the last edition. The reserve is now about 5%.
The last third waits for 6,863 on the S&P 500. That is about 9.1% under Monday’s close. It has no date. Since Friday we have bought nothing and sold nothing.
Now the grade. Our Oct. 28 letter put about one in three on the index falling 7% from its record by year-end. That line is 7,271.60. The lowest close so far is 7,353.73, down 5.95%. So it has not been touched.
What changed? Thursday brought that line much closer, so one in three now looks too low. The same rough arithmetic now says about 62% to touch it by Dec. 31, at the high end. The crowd puts about 50% on a December low of 7,200.
Here is the good news. The plan does not depend on calling the next drop.
If you are retired and drawing income, your next year or two of withdrawals should not depend on stocks in December. The same goes for a tuition bill or a tax bill you already know is coming.
If you are still working and saving for years from now, keep buying on schedule. A drop is a sale for you.
The plan does not depend on calling the next drop.
Dates as printed in the Journal of Nov. 7-8 and Nov. 9, 2026, and the official calendars. None is a forecast.
Prediction markets let people trade on what happens next. By our own pull from Polymarket on Monday, Nov. 9, at about 10:32 p.m. PT: a Fed rate hike in December, 79.5%. No change, 18.5%. A U.S. recession by the end of 2026, 3.8%. The S&P 500 touching a low of 7,200 in December, 50.5%. Touching a high of 8,000 in December, 30.5%. A U.S.-Iran ceasefire in effect by Dec. 31, 79.5%. A government shutdown by Dec. 31, 37%. These are crowd prices, not forecasts, and some of these markets are thin. Tuesday morning, after the inflation report, our 8:56 a.m. PT pull had a December hike at 84.5% and a half-point hike at about 11%.
 U.S. News · Your TaxesA dad opened a Trump account for his toddler. The vote changed no tax law, but a clock started.The midterms changed no tax law, and advisers see about two years before any big change.
 Journal Report · Investing MonthlyLos Angeles homes ranked third among big U.S. metros for 40 years. An index fund still beat them.Over 40 years, Los Angeles homes returned 5.98% a year after tax, and the S&P 500 returned 7.57%.
 Business & Finance · AdvisersThey quit JPMorgan rather than sell Nvidia. One client’s $927 million was over 16% in it.Two advisers left JPMorgan rather than diversify clients out of Nvidia, Broadcom and Dell.
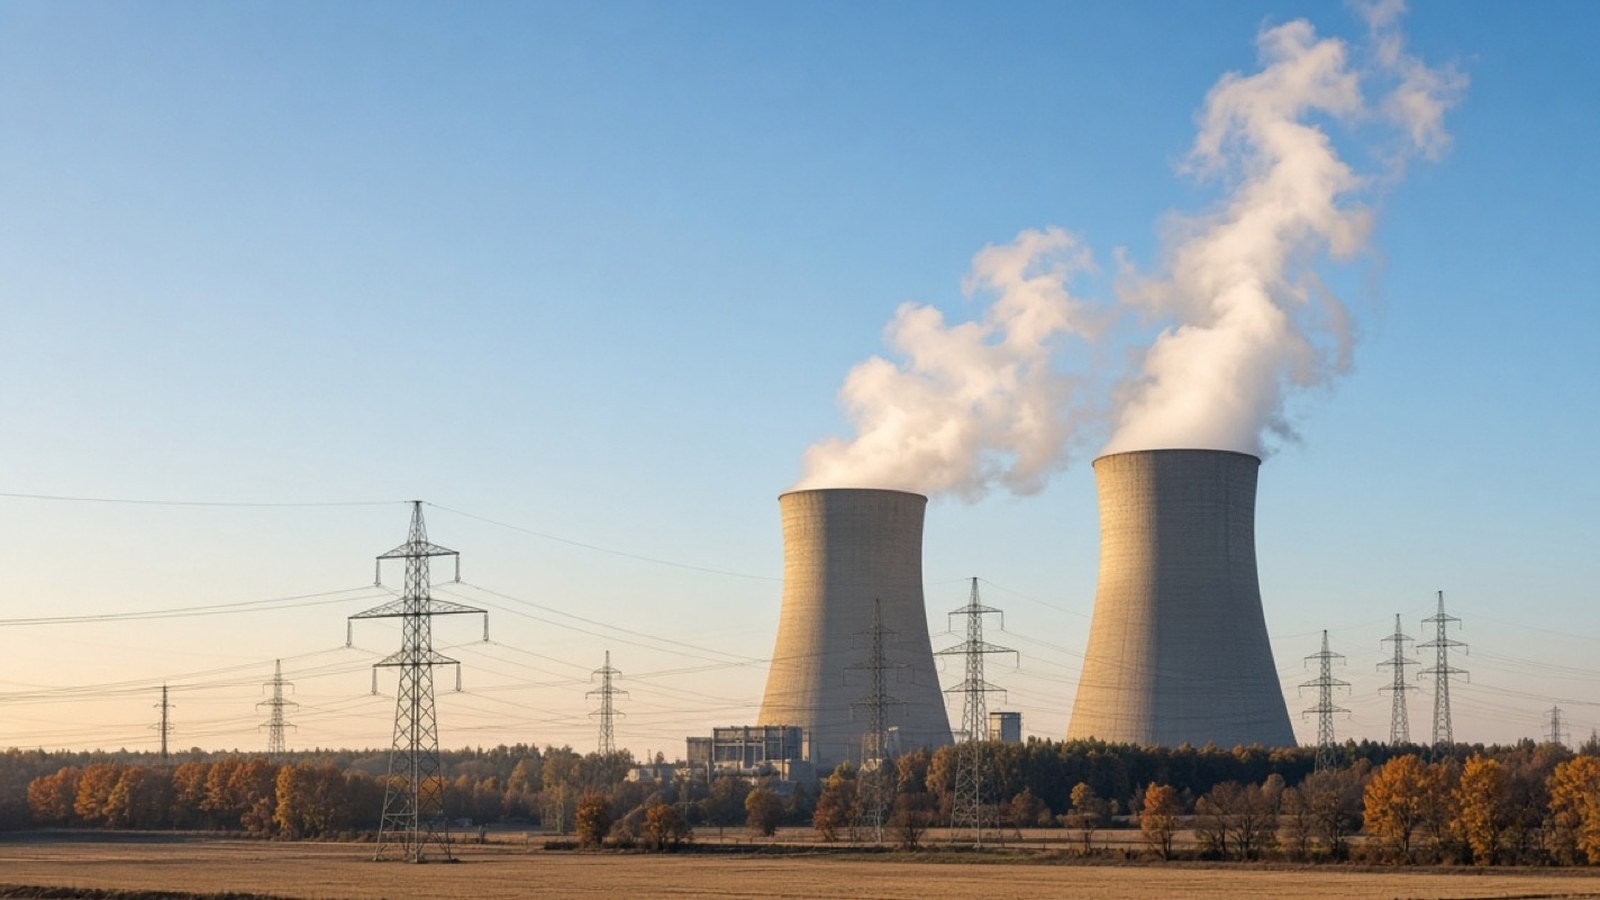 U.S. News · UtilitiesA California utility wants $120 more a month from a typical home. Check how fast your bill grows.Berkshire-owned Pacific Power asked California for a 57% rate increase, about $120 a month.
 Business & Finance · Style & MoneyA fund of 56 Hermès bags made nearly 24% in 15 months. The stock fell 33%. Read the catches.A $1 million fund of Hermès handbags netted nearly 24% in 15 months while Hermès stock fell more than 33%.
Fifteen Minutes This Week
If you are retired, add up the withdrawals you plan to take in the next year or two. See how much of that money sits in stocks today.
The Journal says the ten biggest companies are roughly 40% of the S&P 500, and Nvidia alone is about 7%. Know which kind of fund you hold.
It came in hot. One report rarely changes a long plan. Decide what you’d do with a calm head, and it should usually be nothing.
Prices are up about 3.7% and pay is up 3.1%. Pick your number before the sales start, not after.
Retired? Is your next year of spending out of stocks?
Nobody knows what the next seven weeks hold. Here is what we do know. The year is up. The record leans positive. And the Fed, oil and one inflation report can still surprise us.
You check the roof before the rainy season, not during the storm. Monday was a sunny day. That makes it a good day to look up.
If you’d like to look at your own numbers with us, fifteen minutes on the phone or Zoom is usually enough. Bring your statement, and we’ll find the number that is yours.